Satellite Image Classification

Matheus Schmitz
LinkedIn
Github Portfolio

Project Definition

Artificial Intelligence for Satellite Image Classification

Every minute, the world loses an area of ​​forest the size of 48 football fields. And deforestation in the Amazon Basin accounts for the largest share, contributing to reduced biodiversity, habitat loss, climate change and other devastating effects. However, better data on the location of deforestation and human encroachment on forests can help governments and stakeholders respond more quickly and effectively.

Planet, the designer and builder of the Earth's largest constellation of imaging satellites, will soon be collecting daily images of the entire Earth's surface at a resolution of 3-5 meters. Although considerable research has been devoted to tracking changes in forests, it typically relies on Landsat (30 meters) or MODIS (250 meters) resolution images. This limits its effectiveness in areas where small-scale deforestation or forest degradation predominates.

Furthermore, these existing methods generally cannot differentiate forest degradation between human causes and natural causes. Higher resolution images are exceptionally good at this, but robust methods have not yet been developed for Planet imaging.

In this work, the goal is to classify satellite images with different atmospheric conditions and land cover/land use classes.

Dataset

Datasets with satellite images are available for free on Kaggle:

https://www.kaggle.com/c/planet-understanding-the-amazon-from-space/data

Images are provided in two formats: .tif and .jpg

The .tif files offer better resolution quality, but the final dataset is almost 40 GB. Therefore, for the purpose of this project (which is to study CNNs) we will use images in .jpg format totaling just over 1 GB.

Although images can be extracted from the link above, we've already made it for you and organized it on Titan (DSA server). More details when we upload the images.

Below is a description of the format of the images.

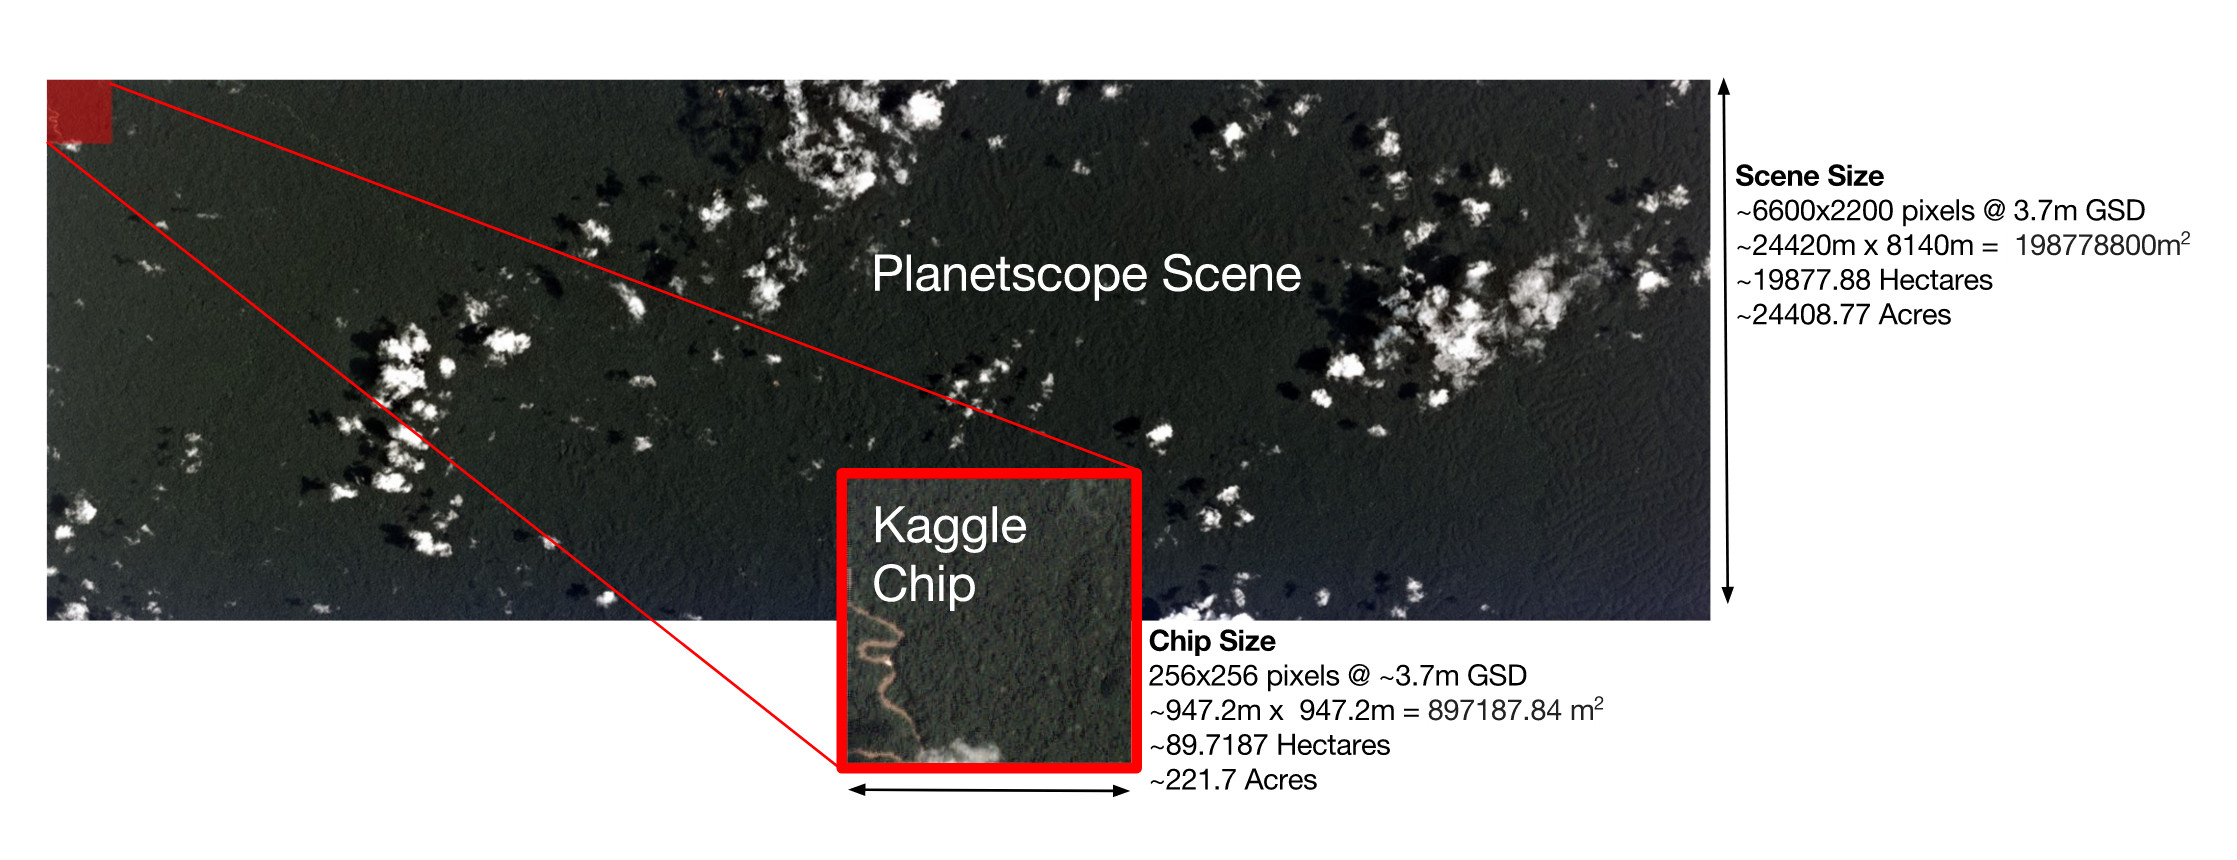
The images have been split into chips, like this one below.

title

The chips were derived from full-frame analysis performed by Planet, using the 4-band satellites in synchronous orbit to the sun (SSO) and the International Space Station (ISS). The chipset uses the GeoTiff format and each one contains four bands of data: red, green, blue and infrared. The satellites' specific spectral response can be found in Planet's documentation. Each of these channels is in 16-bit digital number format and meets Planet four-band orthoanalytic scene product specifications.

The chips are also available in JPG format, which we will use here in the project.

Dataset Creation

In order to assemble this dataset, an initial specification of the phenomena to be found and included in the final dataset was established. From this initial specification, a "wish list" of scenes was created in which an approximate number of scenes needed to obtain a sufficient number of chips to demonstrate the phenomenon were included.

This initial set of scenes was painstakingly collected by the Planet Berlin team using Planet Explorer. In total, this initial set of scenes was approximately 1600 and covered an area of ​​thirty million hectares.

This initial set of scenes was processed using a custom processor to create the 4-band jpg and tiff chips. Any chip that did not have a full four-band product was omitted. This initial set of over 150,000 chips was divided into two sets, a "hard" and an "easy".

The easy set contained scenes that the Berlin team identified as having easier-to-identify labels, such as primary forest, agriculture, housing, roads, water and cloud conditions. The most difficult set of data was derived from scenes in which the Berlin team had selected for cultivation, slash and burn cropland, deforestation, mining and other phenomena.

The chips were labeled using the Crowd Flower platform and a mix of collective labor and teams from Berlin and San Francisco. While the utmost care has been taken to obtain a large, well-labeled dataset, not all of the labels in our dataset are correct. Governments around the world have a large number of highly trained analysts to review images and cannot always agree on what is present in a given satellite image.

Also, the commonly prescribed approach to tagging data in the GIS community is to use real data to tag scenes, which is expensive and time-consuming. With that in mind, the data has a reasonably high signal to noise ratio and is sufficient for training. Given the ease and convenience of labeling multiple files, a large, relatively inexpensive, and quickly labeled dataset is believed to be better than a small, more definitive, but less diverse dataset.

The company SCCON also participated in the project.

Class Tags

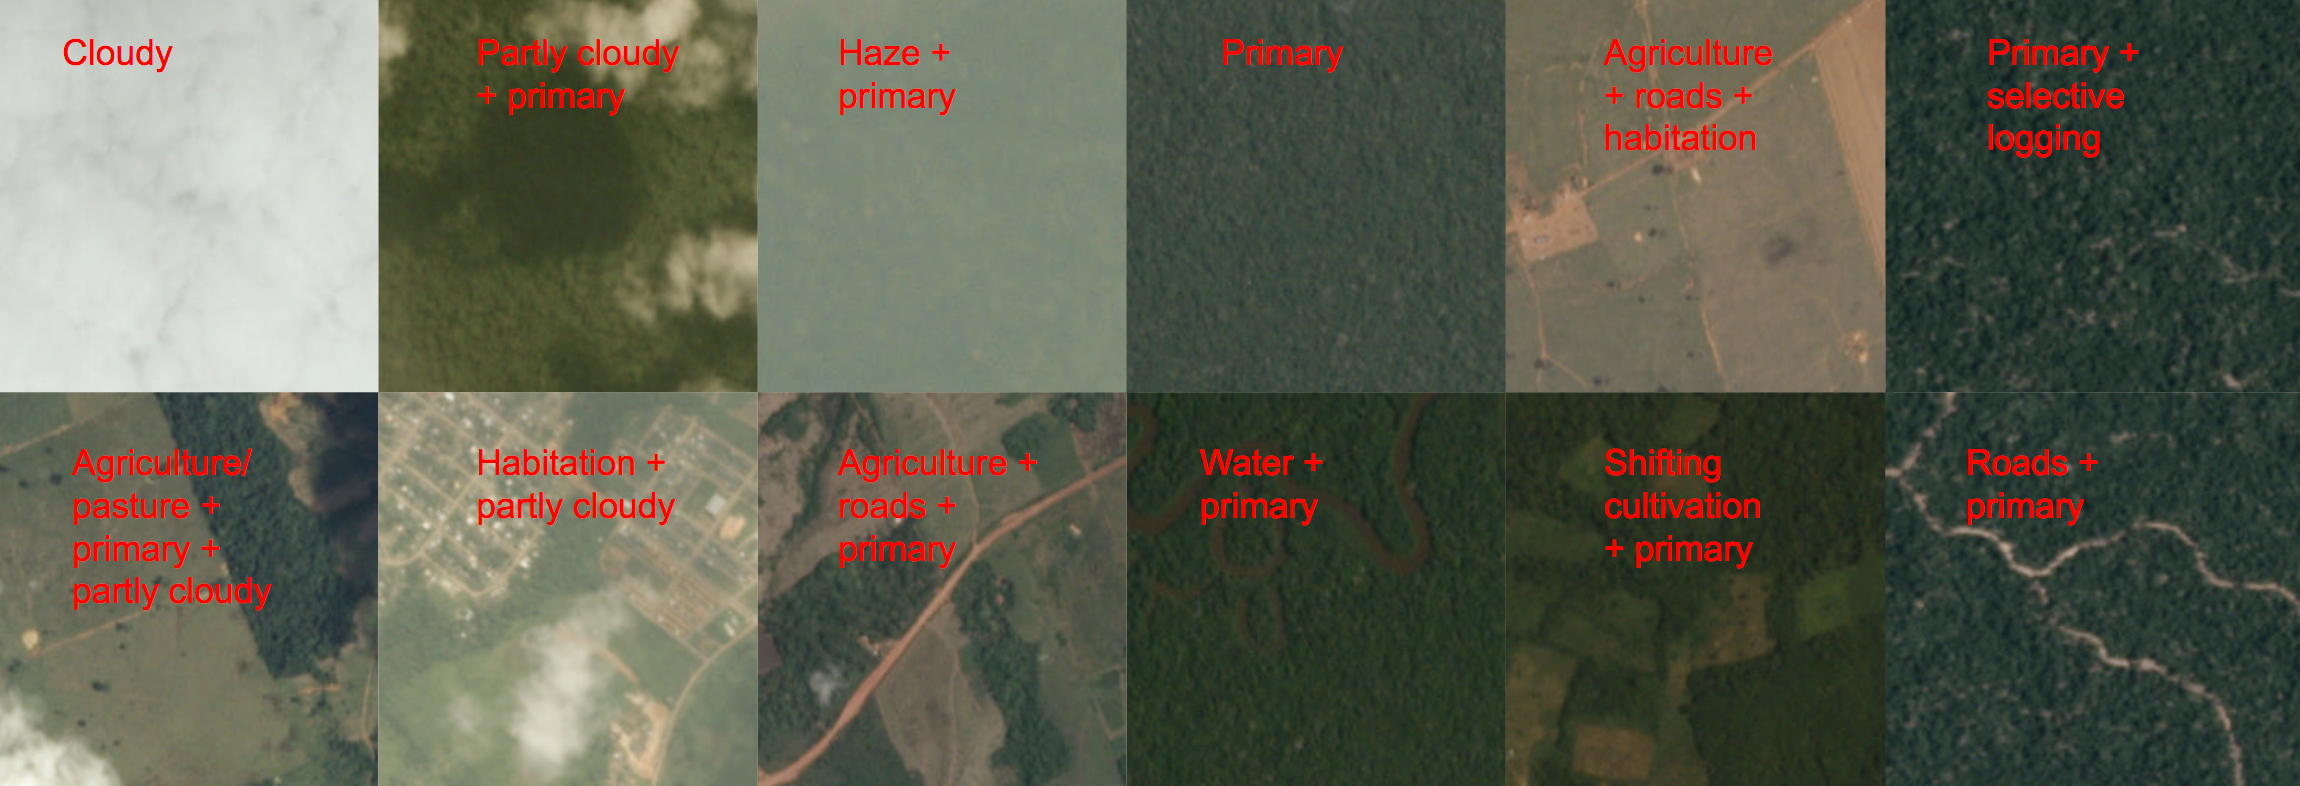
The class labels for this task were chosen in collaboration with the Planet team and represent a reasonable subset of phenomena of interest in the Amazon basin. The labels can be divided into three groups: atmospheric conditions, common land cover/land use phenomena and rare land cover/land use phenomena.

title

Loading Packages

Checking Hardware Available on the Server

Loading Images

Preparing Data

Train Test Split

Choosing Image Resolution for Training the Model

The 128x128 images have good resolution and faster processing than the 256x256 images.

Checking Label Distribution

Build Model

The F-beta score is the weighted harmonic mean of accuracy and recall, reaching its optimal value at 1 and its worst value at 0.

The beta parameter determines the weight of recall in the combined score, with beta < 1 giving more weight to accuracy, while beta > 1 favors recall (beta -> 0 considers only accuracy, beta -> + inf only recall).

Let's create a function for the F-beta score and use it as a metric in validating our model. Scikit-learn has a function for this metric, but the idea is for you to understand what is being done and that's why we're creating ours. Here's the link to Scikit-learn:

https://scikit-learn.org/stable/modules/generated/sklearn.metrics.fbeta_score.html

Train Model with Cross-Validation

Load the Saved Model

The model has great performance and learning was slow. We could increase the learning rate a little bit and train longer in order to increase the accuracy even more.

Training Results and Image Classification

In the table above, each row is an image and each column is a class. Each column represents the class score for that image. All this for 1 single fold.

Let's calculate the average of the results obtained from the cross validation with k (5) folds.

Saving and Displaying Final Result

End

Matheus Schmitz
LinkedIn
Github Portfolio